.svg)
Built for Every Major Accounting & Finance Service Line
Purpose-built workflows that help accounting and finance professionals move faster, work with confidence, and deliver audit-ready results – no matter the engagement.


Audit & Assurance
Save hours performing analytical procedures, reconciliations, and tracing back to the trial balance or general ledger.
Build interactive lead sheets with YoY variances and transaction-level drill-down ability.
Identify trends with AI (cut-off issues, rising customer collection risks, slower inventory turnover, etc.).
.avif)
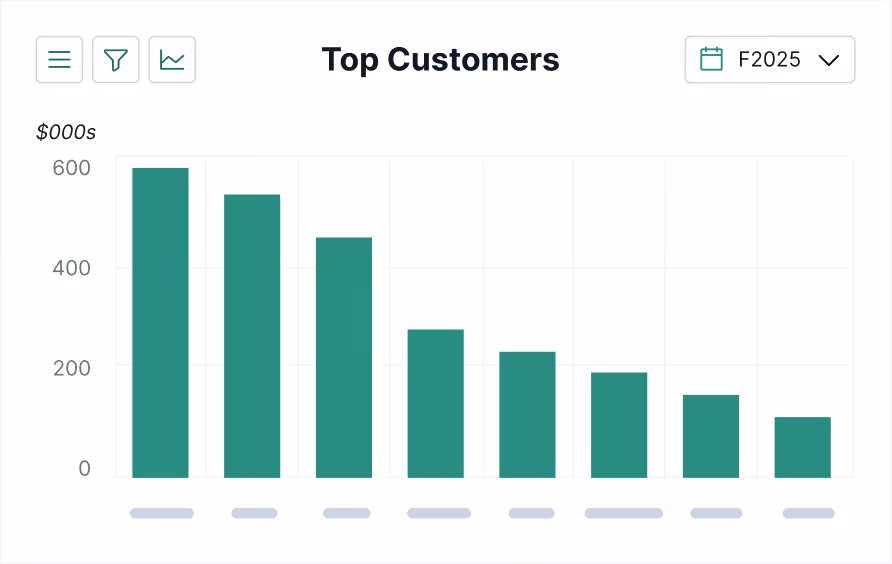
Business Valuation
Automate financial statements with drill-down ability to the trial balance or general ledger.
Build out presentation-ready graphs and tables, such as top customer tables or sales charts.
Get data (tax rates, updated foreign exchange rates, TB account balances, etc.) directly into your valuation models.
Deal Advisory and M&A
Generate instant tables and charts to assist with financial modelling and analyze EBITDA, sales growth, monthly working capital, etc.
Analyze financial data across flexible time-based views (e.g., monthly, quarterly, LTM, YTD), powered by Fangtooth’s SmartPull Excel formulas.
Link financial data to Fangtooth AI to generate key insights and identify deal drivers.
.avif)
.avif)
.avif)
Financial Due Diligence
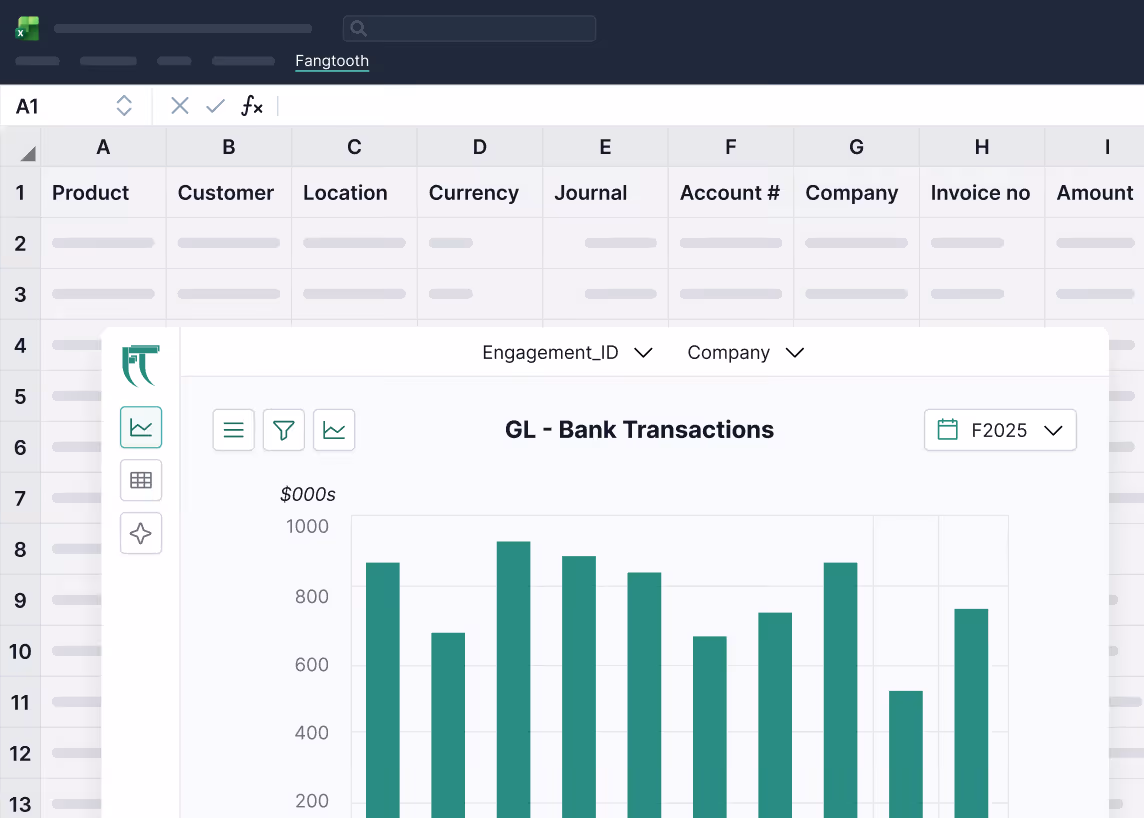
Presentation-ready tables and graphs: EBITDA waterfall, price to volume, top customers and many more with all graphs being exportable to Excel.
Analyze financial data across flexible time-based views (e.g., monthly, quarterly, LTM, YTD), powered by Fangtooth’s SmartPull Excel formulas.
Manage and access large amounts of data from a centralized source.
Financial Planning & Analysis
Generate instant tables and charts to assist with budgeting and forecasting, performing variance analysis, and preparing management reports.
Interactive lead sheets with YoY variances and transaction-level drill-down ability.
Link financial data to Fangtooths AI to generate key insights, identify trends and monitor business drivers.
.avif)
Litigation Support & Forensics
Trace every output to the source with transaction-level drill down ability across general ledgers and other large datasets.
Categorize GL descriptions using our proprietary AI-powered Excel formulas and leverage Fangtooth AI to analyze or summarize confidential legal documents.
Generate professional visualizations, tables, and graphs for expert reports.
See How Fangtooth Supports Your Service Line
Book a demo to explore how Fangtooth adapts to your workflows and helps your team deliver faster, clearer, and more defensible financial work.

