.svg)
Powerful Analysis,
Without Leaving Excel
Fangtooth embeds automation and AI directly into Excel, helping accounting and finance teams analyze large datasets faster, with accuracy and confidence


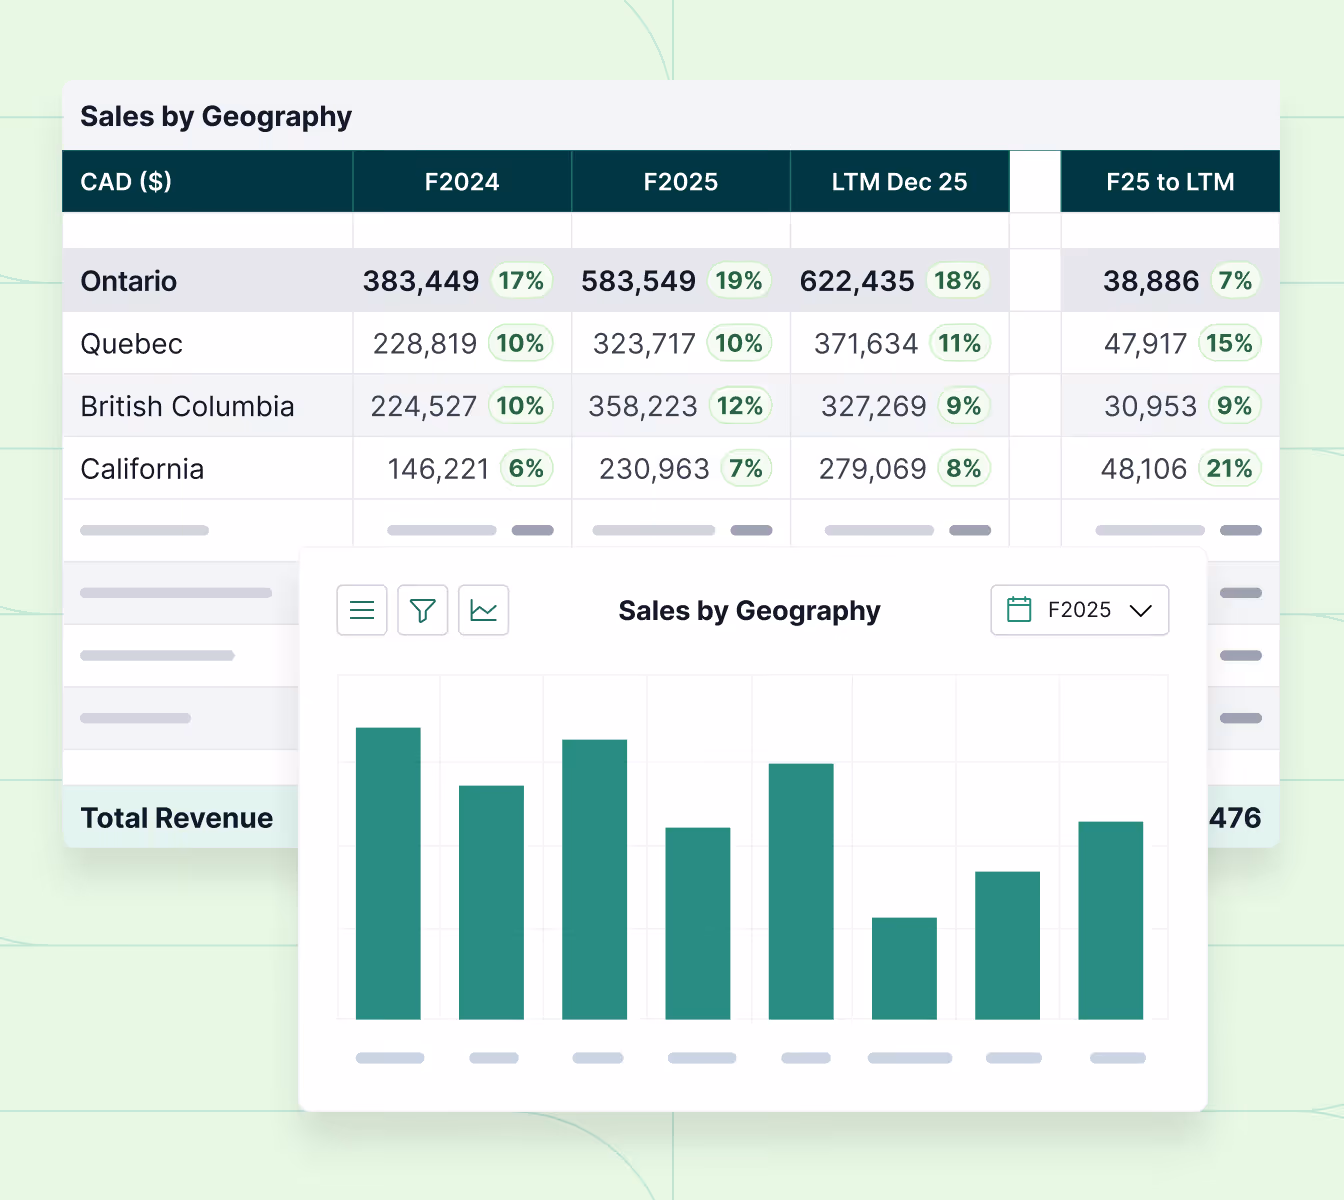
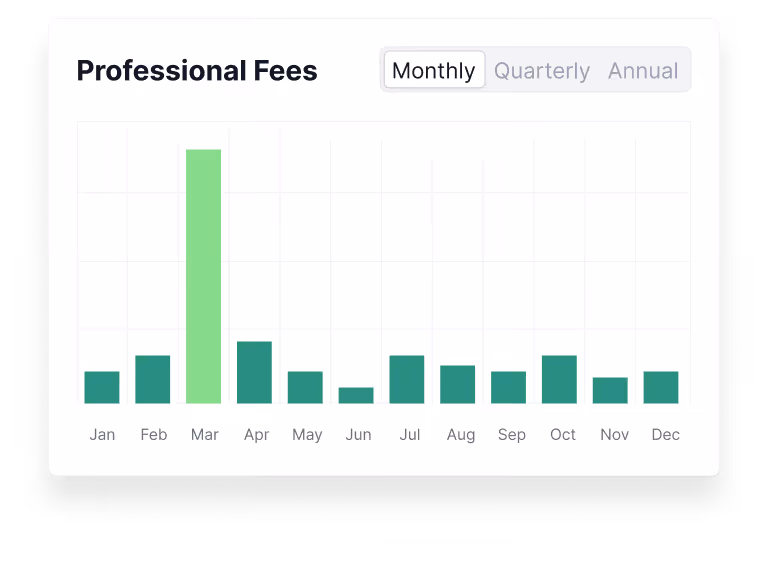
Automate Professional-Looking Financial Schedules
Fangtooth supercharges your ability to build professional financial schedules and graphs directly in Excel, saving hours of manual formatting and repetitive work. Create dynamic tables for a wide range of outputs, including:
Financial statements (monthly, quarterly, or annual)
Lead sheets with variance analysis ($ and %)
Top customers and vendors
Sales by product or geography
AR/AP aging schedules
EBITDA waterfalls
Working capital and key financial ratios
And many more
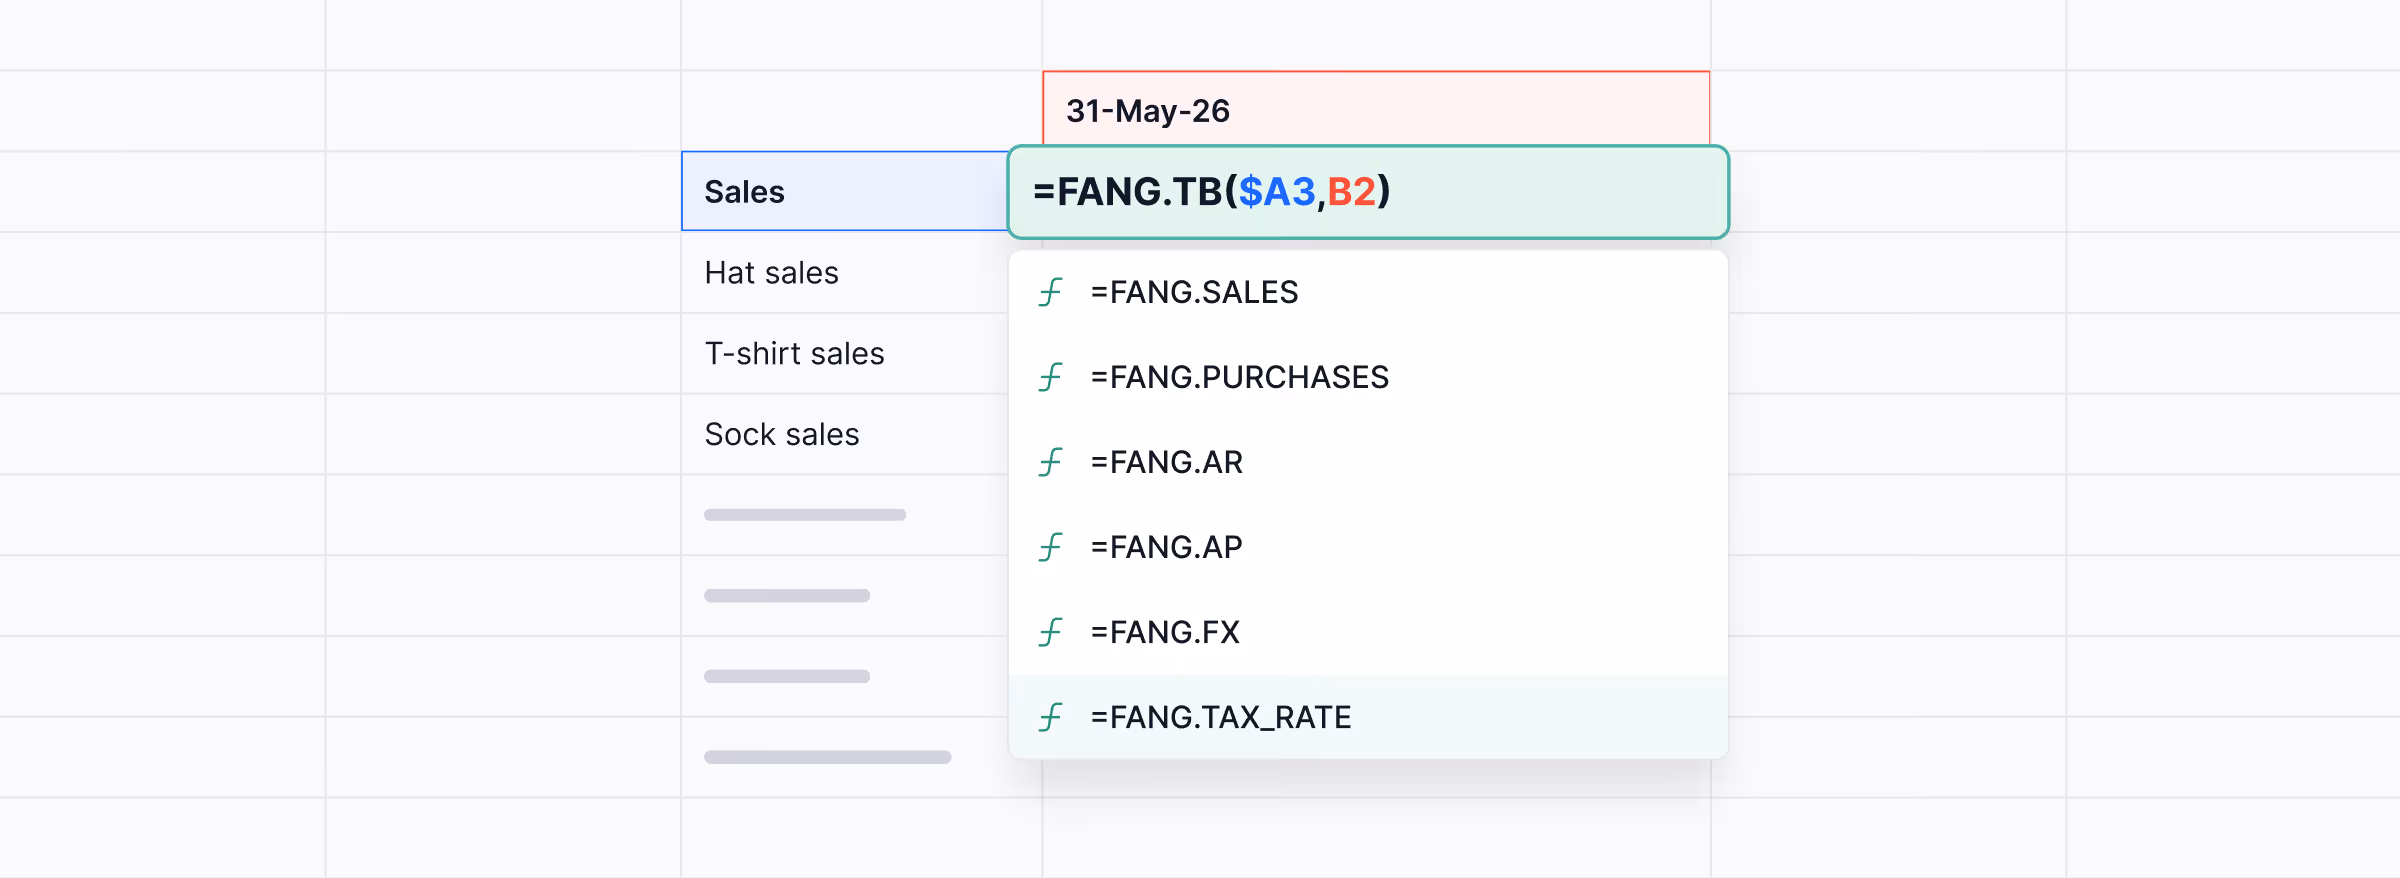
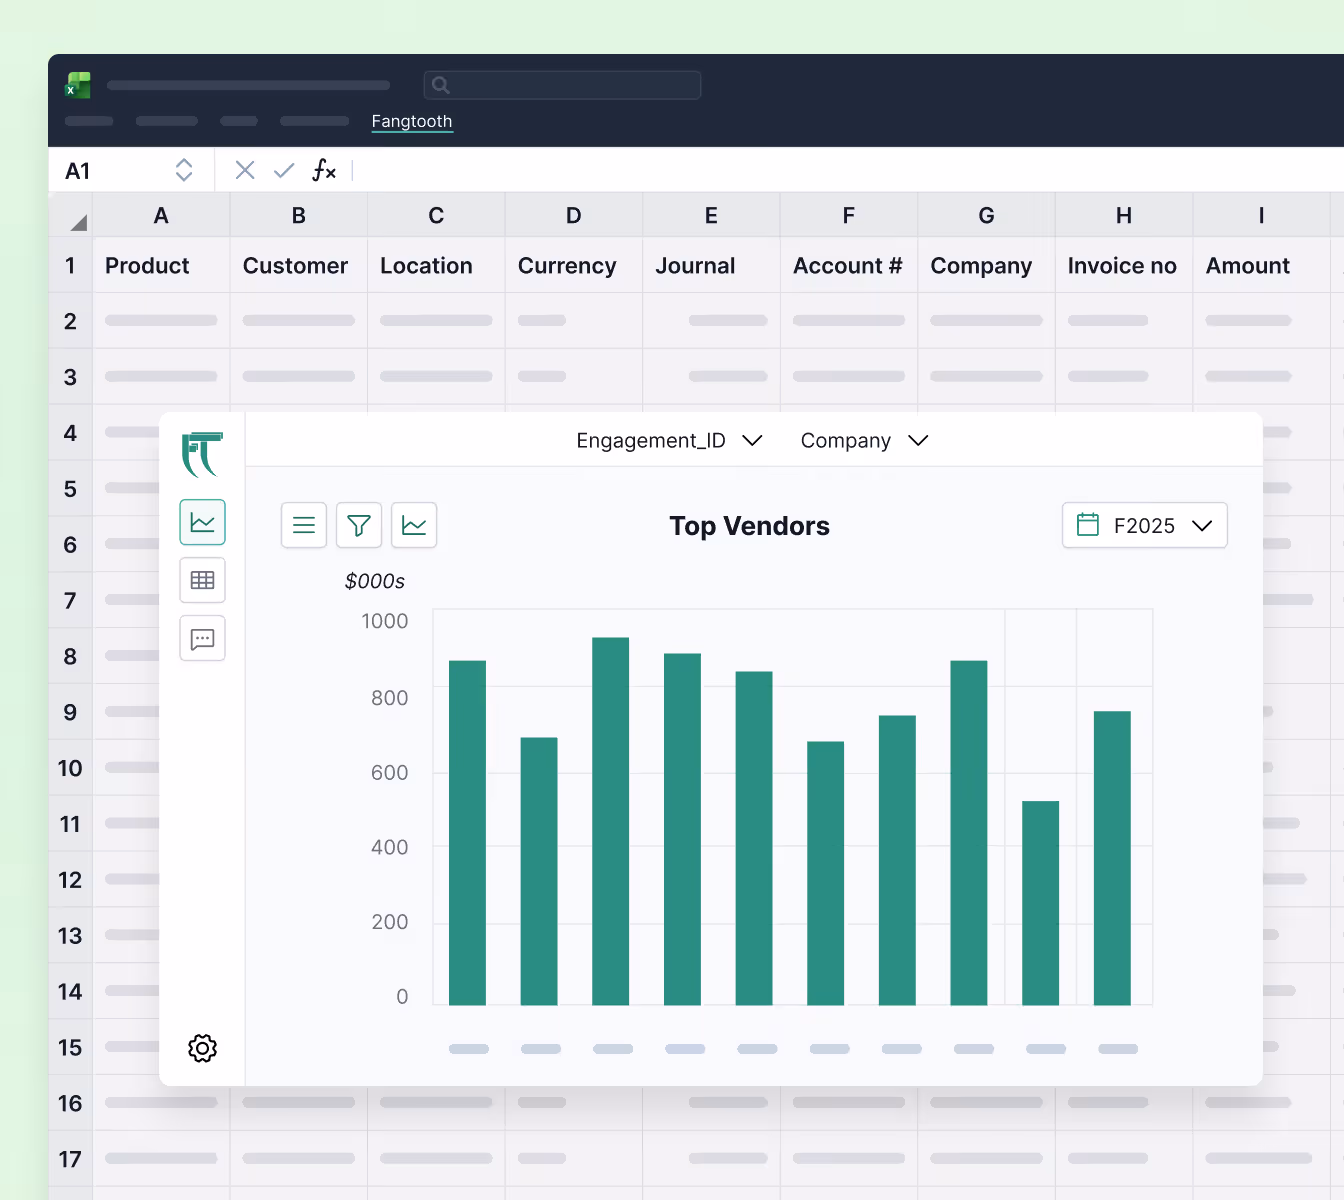
Work in Large Datasets with Speed & Efficiency
Large, complex datasets are no longer a barrier to productivity. SmartPull formulas allow users to get data from external datasets (e.g. general ledgers, trial balances, and other ledgers), instantly populating your spreadsheet while keeping Excel light and responsive.
External datasets are centralized on your cloud storage platform (e.g. OneDrive) and accessed from any spreadsheet via Fangtooth.
.avif)
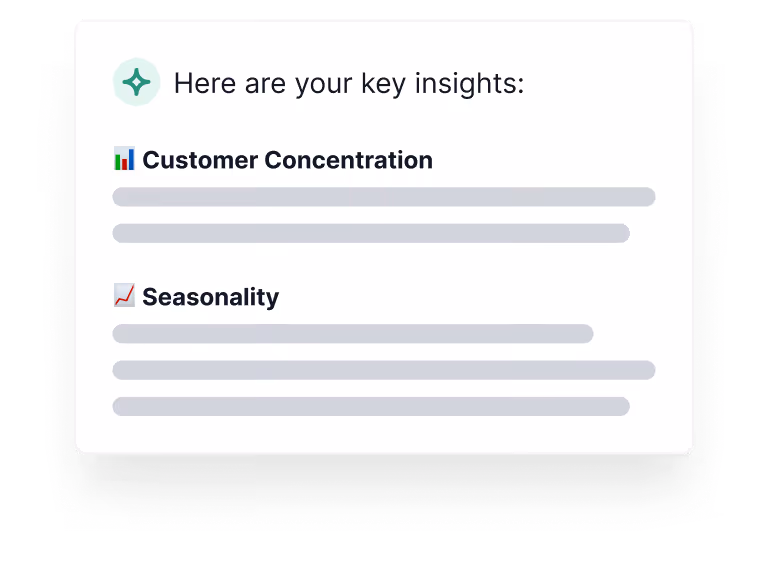
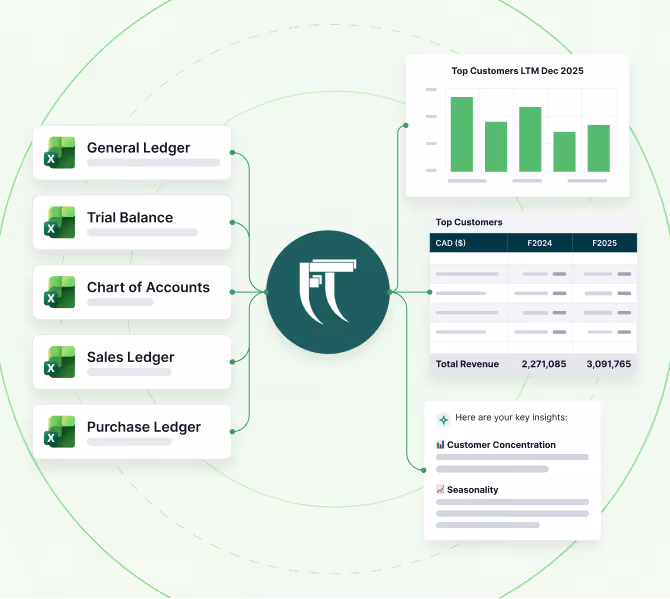
Your AI Financial Analyst
Confidential insights – Fangtooth AI is closed and “privately deployed”, so sensitive financial data stays contained in your organization’s ecosystem. Fangtooth AI is also integrated with your data, so you can:
Generate thoughtful insights
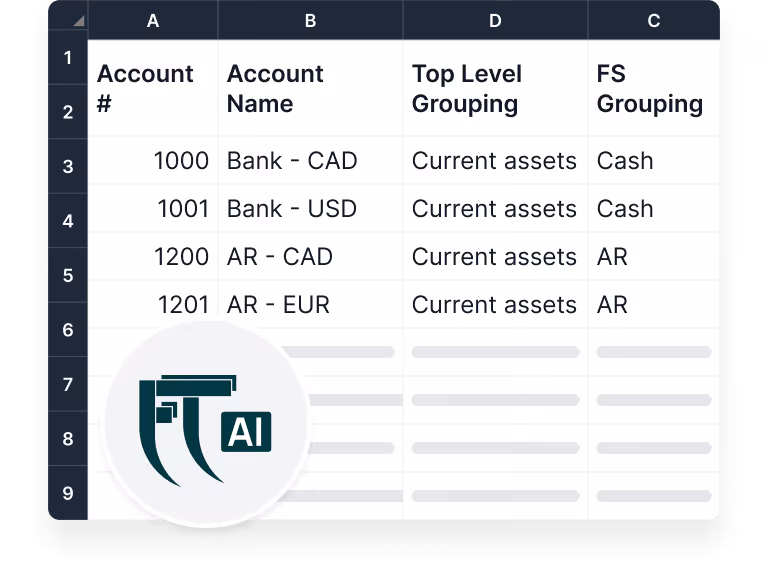
Build AI-assisted Chart of Accounts
Detect irregularities & trends
Investigate the Details with Ease
Investigate variances by drilling down from the financial statements to GL transaction detail.
Double click to drill down from summary schedules and lead sheets to transaction-level detail.
No more manually searching across large datasets or multiple workbooks to trace a number back to its source.
Seamless Onboarding & Data Integration
Fangtooth’s straight-forward interface makes the data setup time painless with automated checks to help you resolve mapping and other data issues immediately.
The best part: you have the flexibility to update, append, or edit the underlying data at any time. If a change is made to the source, Fangtooth updates your existing analyses in real time.
.avif)
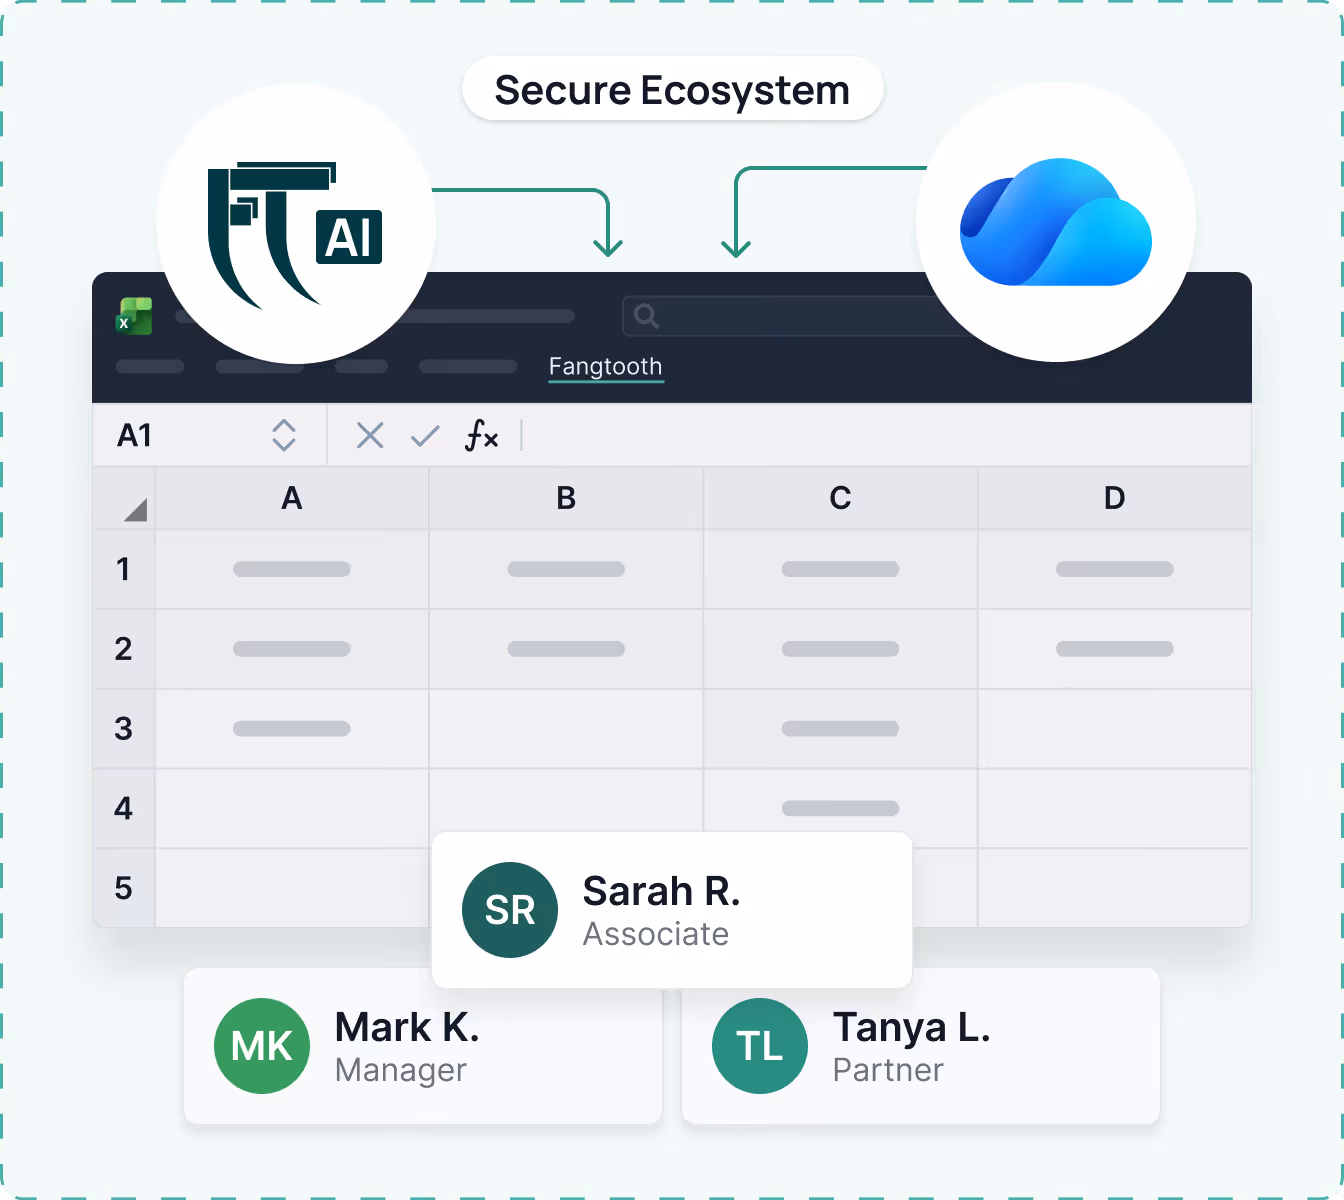
Perfect for Teaming & Collaboration
Invite other team members: Once your engagement is set up, team members can access the same dynamic schedules in real-time.
Never leave Excel: Fangtooth is conveniently available within any spreadsheet, giving you access to hundreds of analyses where you already work.
One single source of truth: All your financial data is stored in one secure location. No confusion about which underlying source data is used for your analyses.
See How Fangtooth Elevates Your Workflow
Book a demo to see how Fangtooth replaces manual processes with faster, smarter, and more reliable financial workflows.

